

![[SAP HCM PY] How to evaluate your schema performance?](https://cdn.hashnode.com/res/hashnode/image/stock/unsplash/301dd73fbab638c1face3501ec5bd18e.jpeg?w=1600&h=840&fit=crop&crop=entropy&auto=compress,format&format=webp)


BREAK dungbv7.
Have you ever wondered which part in your payroll schema is the slowest one? If the answer was yes, this post is totally for you.
1. Understanding business requirements
Payroll and Time schemas play a crucial role in the running of SAP HCM. It’s challenging yet important to keep your schemas working smoothly and efficiently.
However, how do we know which parts of the schemas need to be tuned and which parts became obsolete over time?
The latter task is indeed a huge one and needs much time on comparing business requirements along with the schema's content.
In this blog post, I will introduce to you one tool to accomplish the former task, which is to measure your schemas' performance in terms of processing time.
2. Understanding system configuration
Literally, we don’t config anything here :)) Instead, we'll use a built-in program of SAP called SAT.
SAT is a standard tool of SAP for monitoring and evaluating the performance of ABAP programs. With SAT, we can deep dive into the processing sequence as well as the processing speed of each component in any ABAP program.
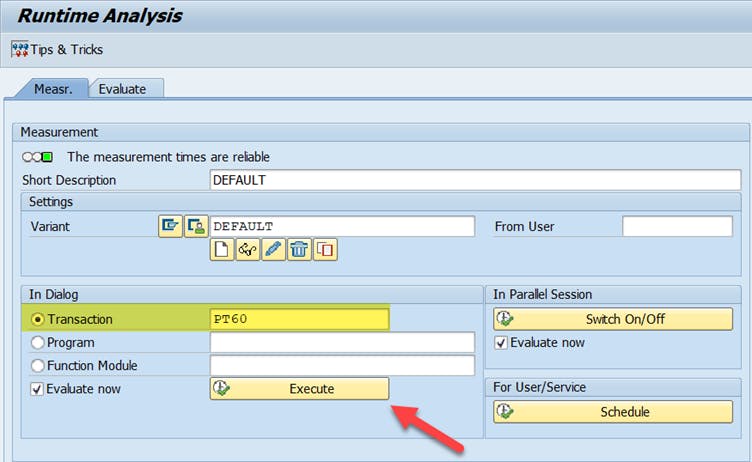
Let's say I want to measure the speed of Time Evaluation program when running with the ZM00 schema, I fill in the Tcode PT60 in the Transaction box and then click the Evaluate button:
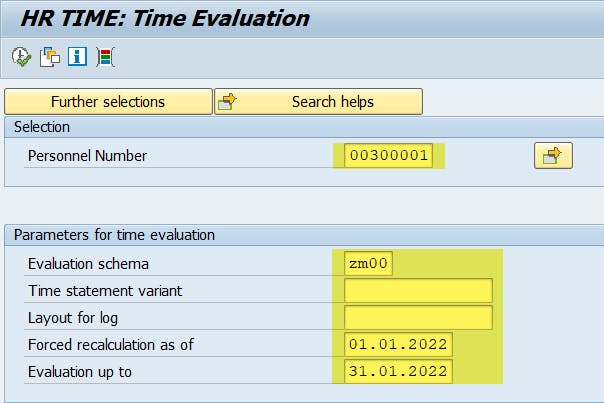
Then I run PT60 with a sample set of data:
After that, SAT give me a set of speed measurement reports for PT60, which divide into 5 tabs:
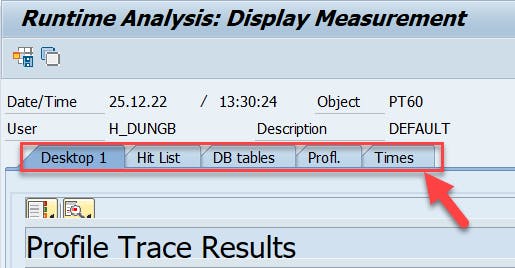
Desktop 1: an overview of performance analysis.
Hit list: displays a hit list of all measured statements. Identical events are summarized into one trace line together with their execution times.
DB tables: identifies time-consuming database statements.
Profiles: shows you the runtime distribution of components, packages, programs and even debugger layers.
Times: displays more specific time measurement values for the single events of the call hierarchy.
Before diving deeper into the performance measurement results, let me give you a quick view of the structure of time evaluation and payroll driver program.
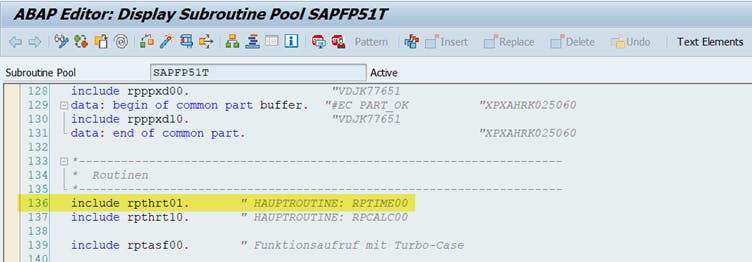
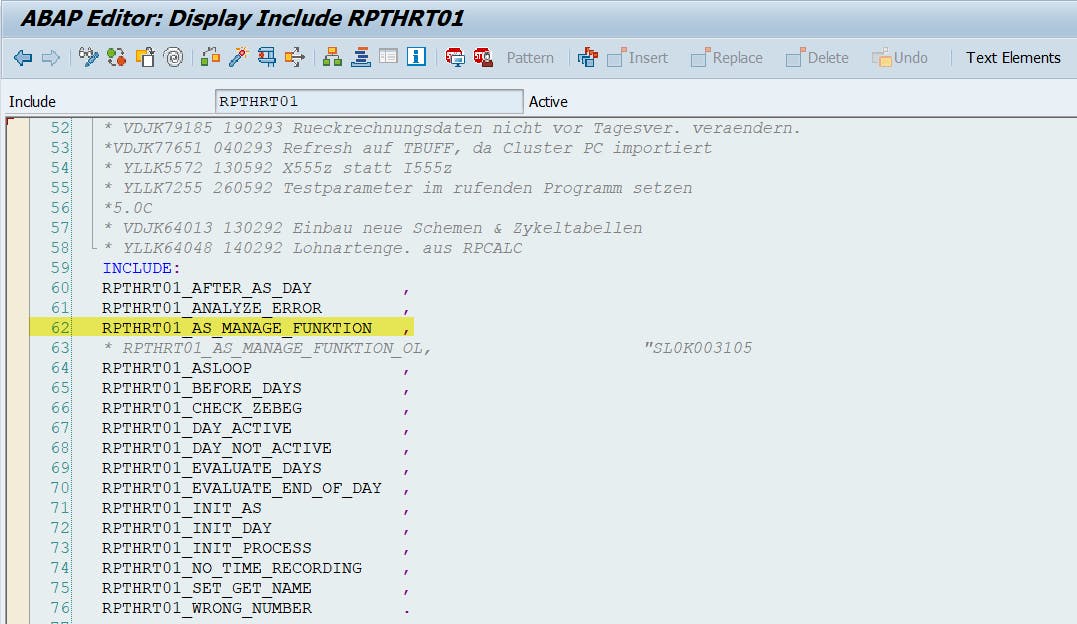
When the time or payroll program is called, the system will automatically trigger include RPTHRT01 (for time) or RPTHRT10 (for payroll):
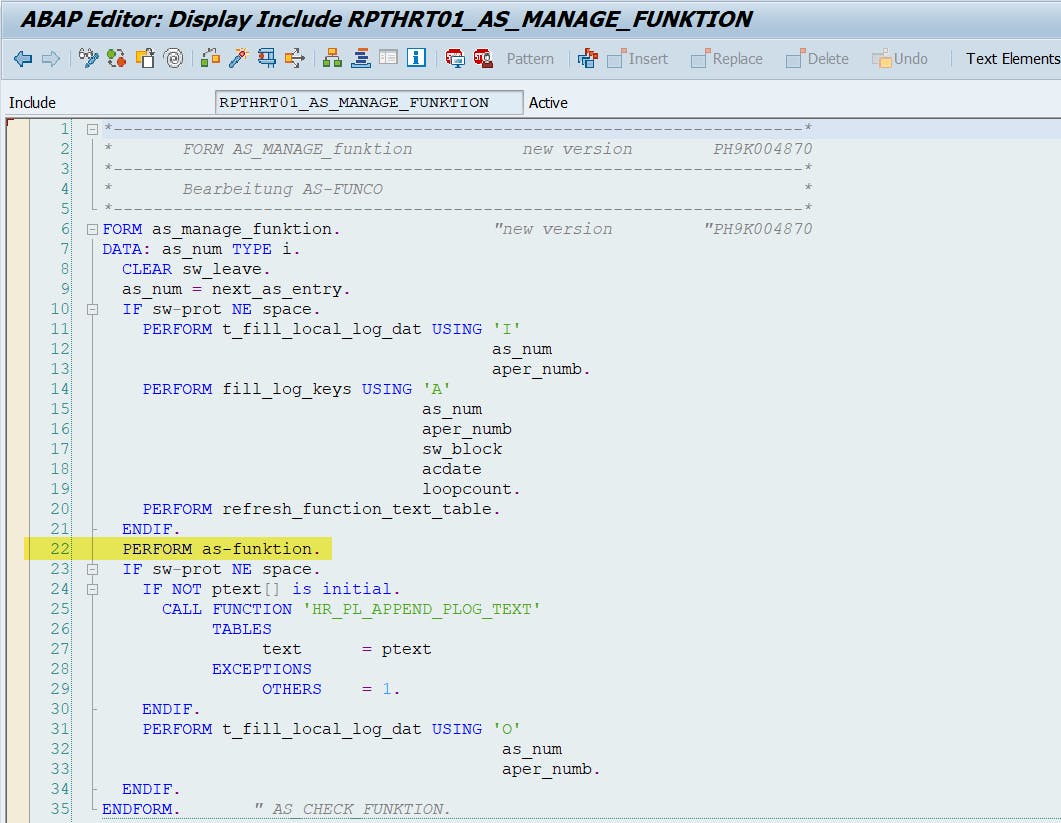
Within these includes, there is a sub-include named RPTHRT01_AS_MANAGE_FUNKTION.
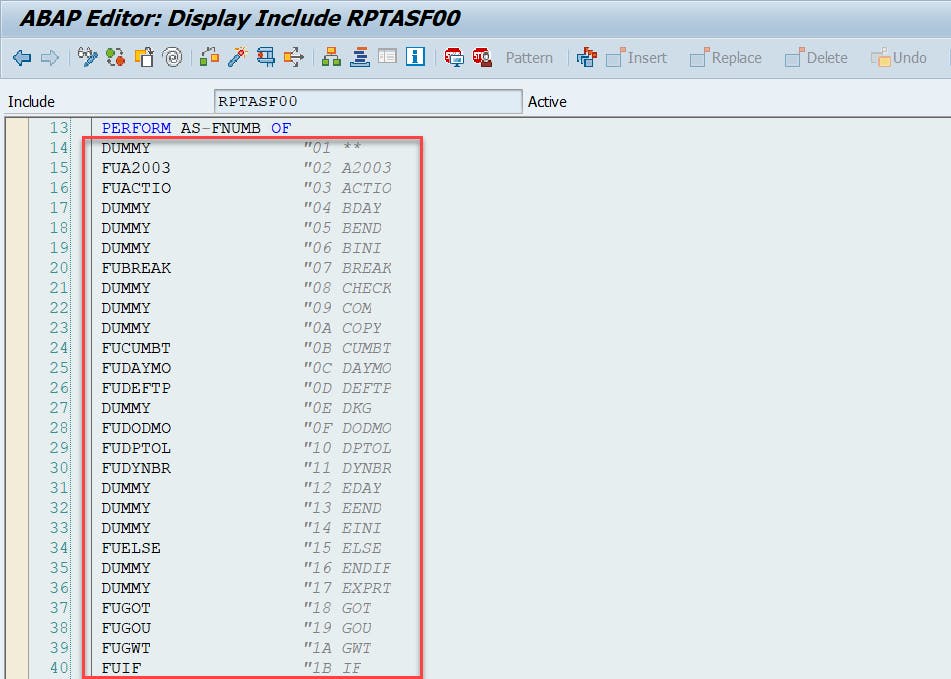
Each time the program processes a line in the schema, the system calls this AS-FUNKTION form to trigger the corresponding code to the function name.
Now let's go back to the SAT measurement results table.
When filtering the Statement/Event column with the value Perform AS-FUNKTION, we can see this form is called 2,607 times, accounting for more than 97% of the total processing time of the program (9.7 seconds).
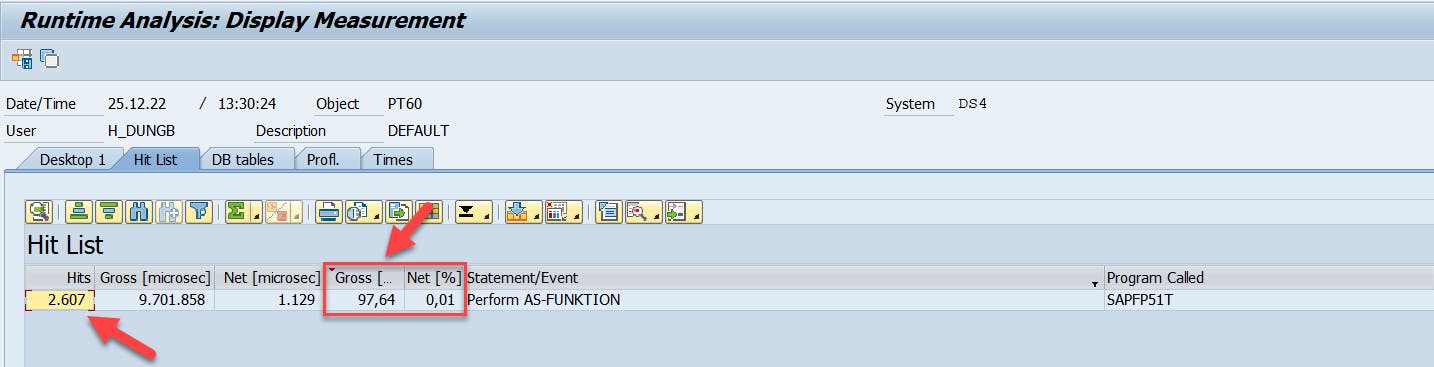
\=> This AS-FUNKTION is truly the heart of PT60 program.
Continue filtering with the value Performance (ext) FU we will see which function is called and how many times it is called:
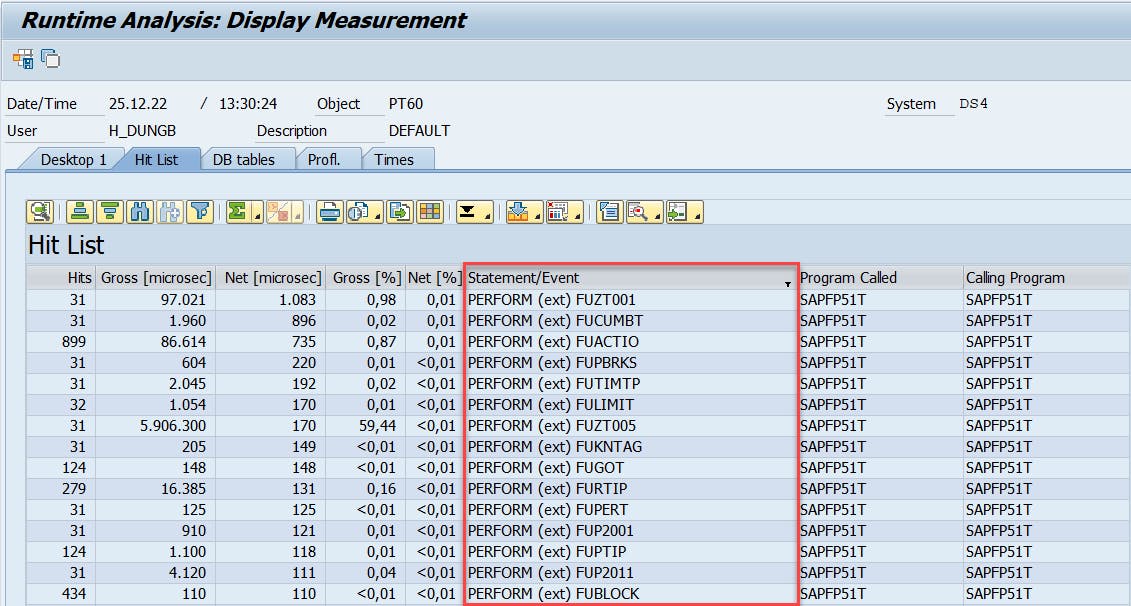
After sorting in descending order of the Gross [%] column, we will encounter the functions that have the slowest processing time:
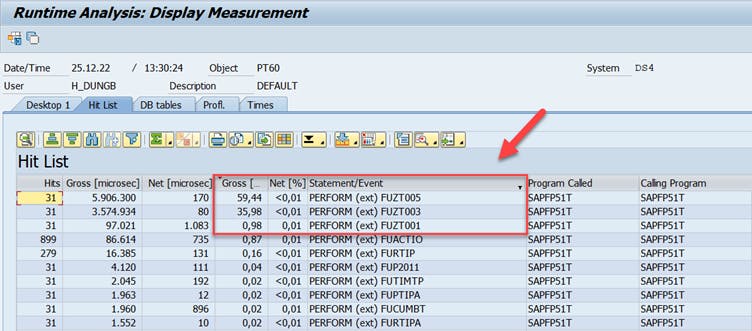
So the 3 slowest functions are all custom functions (ZT001, ZT003 and ZT005). Each function is called 31 times, once a day.
Note: Gross [%] is about the total processing time of the parent statement/event and all the child statements/events inside it. While Net [%] only takes into account the processing time of the parent statement/event.
The fact that the three Z functions all have a small Net [%] but a large Gross [%] implies all these functions just handle a small code and then trigger others functions/methods/subroutines.
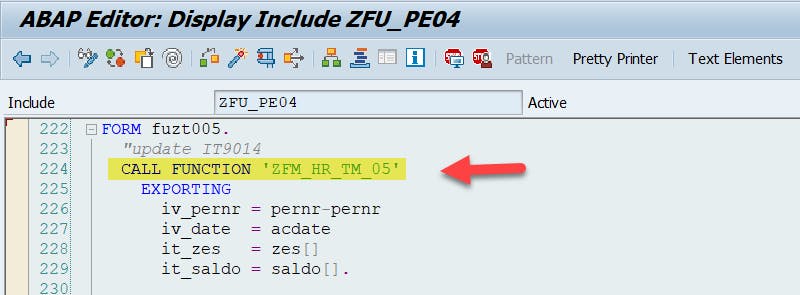
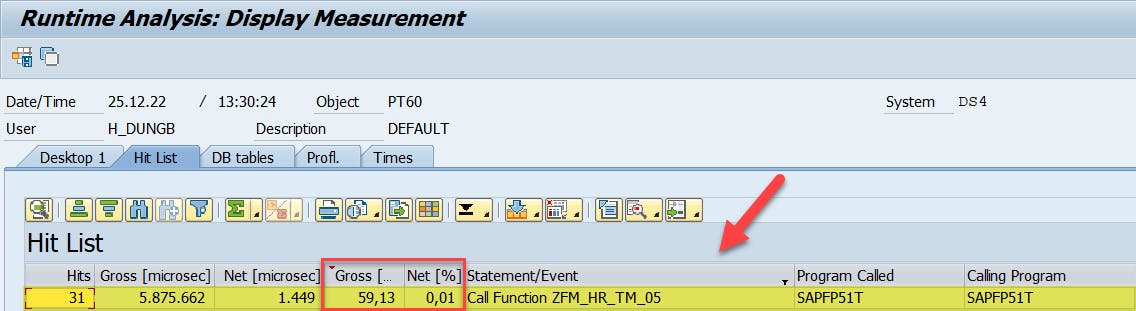
To find out which they lead to, double-click on a line:
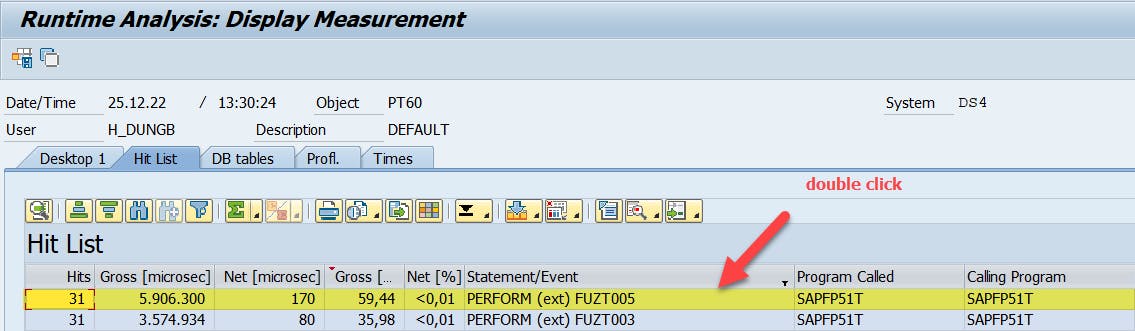
We can see the function ZT005 calls the function module ZFM_HR_TM_05:
Going back to the SAT screen, after filtering by function ZFM_HR_TM_05, once again we meet the situation where there is a large amount of Gross [%] but a small amount of Net [%], this means that ZFM_HR_TM_05 continues to call small objects inside it.
Now I have 2 choices, one is to learn about the algorithm of ZFM_HR_TM_05 and research ways to increase its speed. The other is to study the business facets of this function, to find out whether I can do it differently or not.
Luckily for me, after doing a little research I found out that ZT005 is used for writing down time evaluation results into some infotypes. Which means it should be called only 1 time at the end of the processing period, not 31 times a month like the current logic.
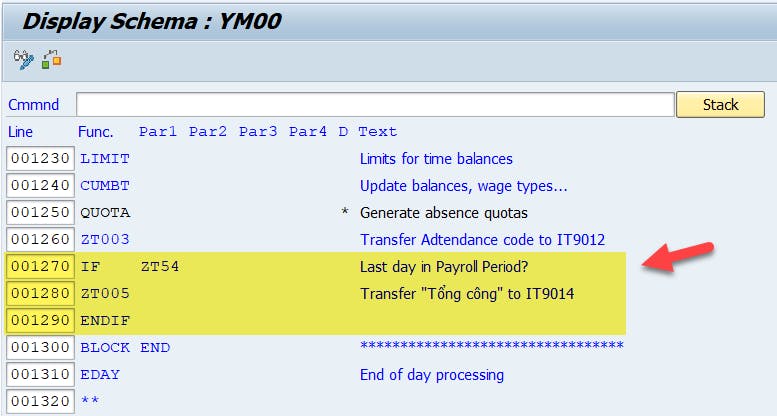
So, I created a new schema named YM00 and put the ZT005 function inside a conditional block:
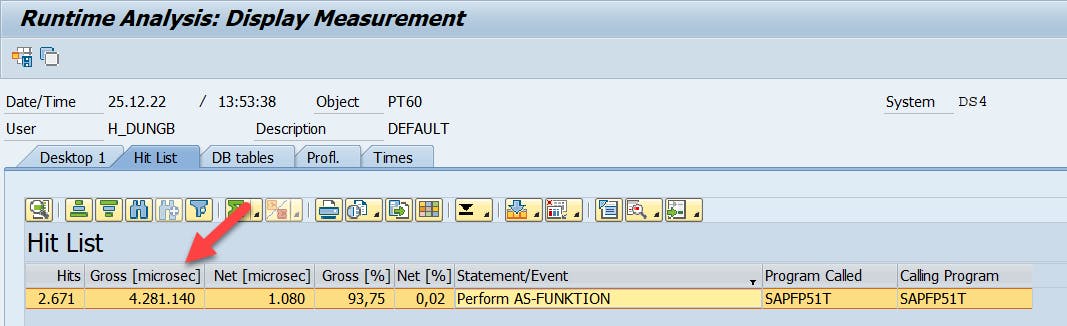
After measuring again, SAT returned the total processing time of AS-FUNKTION was only about 4.3 seconds (ie, the processing time is decreased by more than 2.2 times). That's a pretty good result, isn't it?
We can use the same way to approach the other functions and improve their speed as well.
Ok I guess this is the end. Hopefully through this post you can obtain something that useful for yourself, thanks for reading and see you again soon.
May the best solution be with you!